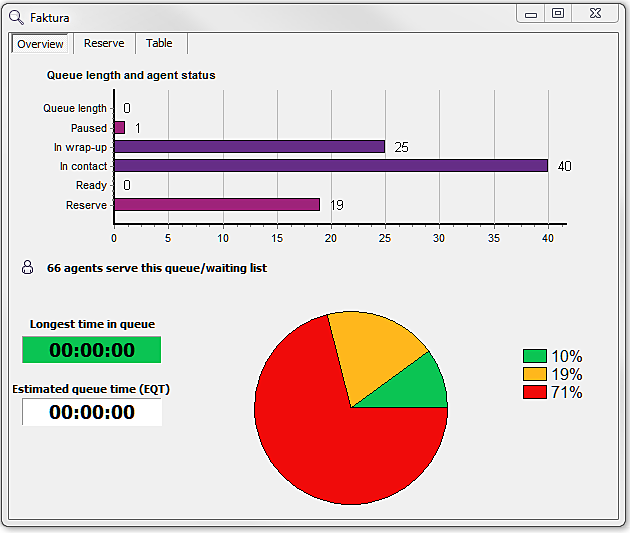
The Overview tab displays facts graphically, as diagrams. The graphic presentation can be seen in two ways:
How to set a compact view is described in section Save space with compact view and merged windows
The following information is shown:
| Queue length |
The number of contacts waiting in the specific queue/waiting list. This does not include the contacts that are currently being served after waiting in the queue/waiting list. |
| Paused |
The number of paused agents logged in to work level queue and serving the current queue/waiting list. Includes all agents that are logged in to this queue/waiting list, also outside the selected subarea. |
| In wrap-up |
The number of agents in wrap-up logged in to work level queue and serving the current queue/waiting list. Includes all agents that are logged in to this queue/waiting list, also outside the selected subarea. |
| In contact |
The number of agents in contact logged in to work level queue and serving the current queue/waiting list. Includes all agents that are logged in to this queue/waiting list, also outside the selected subarea. |
| Ready |
The number of ready agents logged in to work level queue and serving the current queue/waiting list. Includes all agents that are logged in to this queue/waiting list, also outside the selected subarea. |
| Total no. of agents |
The number of agents logged in, belonging to the organisation area and having a profile that allows them to help serve the queue/waiting list. If View Subarea is chosen in the main window, a particular subarea has also been specified in that window. However, Total No. of agents also includes agents not included in this subarea. |
| Longest queue time |
Which is the longest time any of the contacts who are currently in the queue/waiting list have been waiting. |
| Estimated queue time |
An estimated value on queue time for the contact at the end of the queue. The value is based on current queue length and how long queue time has been for earlier contacts in the queue. This may be the queue time read out in IVR. |
|
Service level |
Is displayed with a pie chart. The diagram has up to three sectors. The green sector shows what proportion of all contacts ‘today’ that has fulfilled both service requirements, the yellow sector shows the proportion that has fulfilled only the less stringent service requirement, and the red sector shows the proportion that has not fulfilled either of the two service requirements. |

The waiting times that are compared with the thresholds for various service levels always include queue time and ring time for incoming calls. Depending on the configuration in CallGuide Admin, the waiting times can also include connection time. Connection time for a call is considered as the interval from the time when IVR receives information about extension number for the call, until the time when the call has been transferred to the extension (so that it can start ringing there).
Colour coding is used to quickly see whether the service is acceptable or not. A colour code indicates which service level the one that has been waiting longest in the queue/waiting list would receive, if the contact would be served immediately. Green indicates service level 1, yellow service level 2, while Red means that neither of the two service requirements is fulfilled. The colour is used as the background to the Longest queue time parameter value and as the colour for the Queue length bar.
Service requirements are configured in CallGuide Admin. If a particular queue/waiting list does not have specifically configured service requirements, those that are configured for the entire organisation area are used.
Telia CallGuide version 10.1. New info since last release is highlighted. ©Telia Sverige AB